
Dramatic Dominion Deception in Denver
Dramatic Dominion Deception in Denver
Denver County, CO comes from behind for the 2020 election voting machine algo framework deception win at 3:1!

First of all, latecomers to my recent series on voting machine algorithm cheating should probably go read at least my “2020 Vote Manipulation in Pasco County, FL” post first. If not you will likely do so at the end of this as it remains my best compendium and overall perspective post covering all the “lesser deceptions” of “only 2:1” frameworks that I have found so far. (This post is possible only now since CVR files for numerous CO counties were added to the ordros.com site yesterday including for Denver — kudos to Jeff, Mama and Draza for their efforts leading the charge to gather these CVRs!)
In this post I’m going to assume you are somewhat up to speed and just put things on blast — but I will use a new simplified dual pronged mode of explaining the situation in my two bullets under the chart:
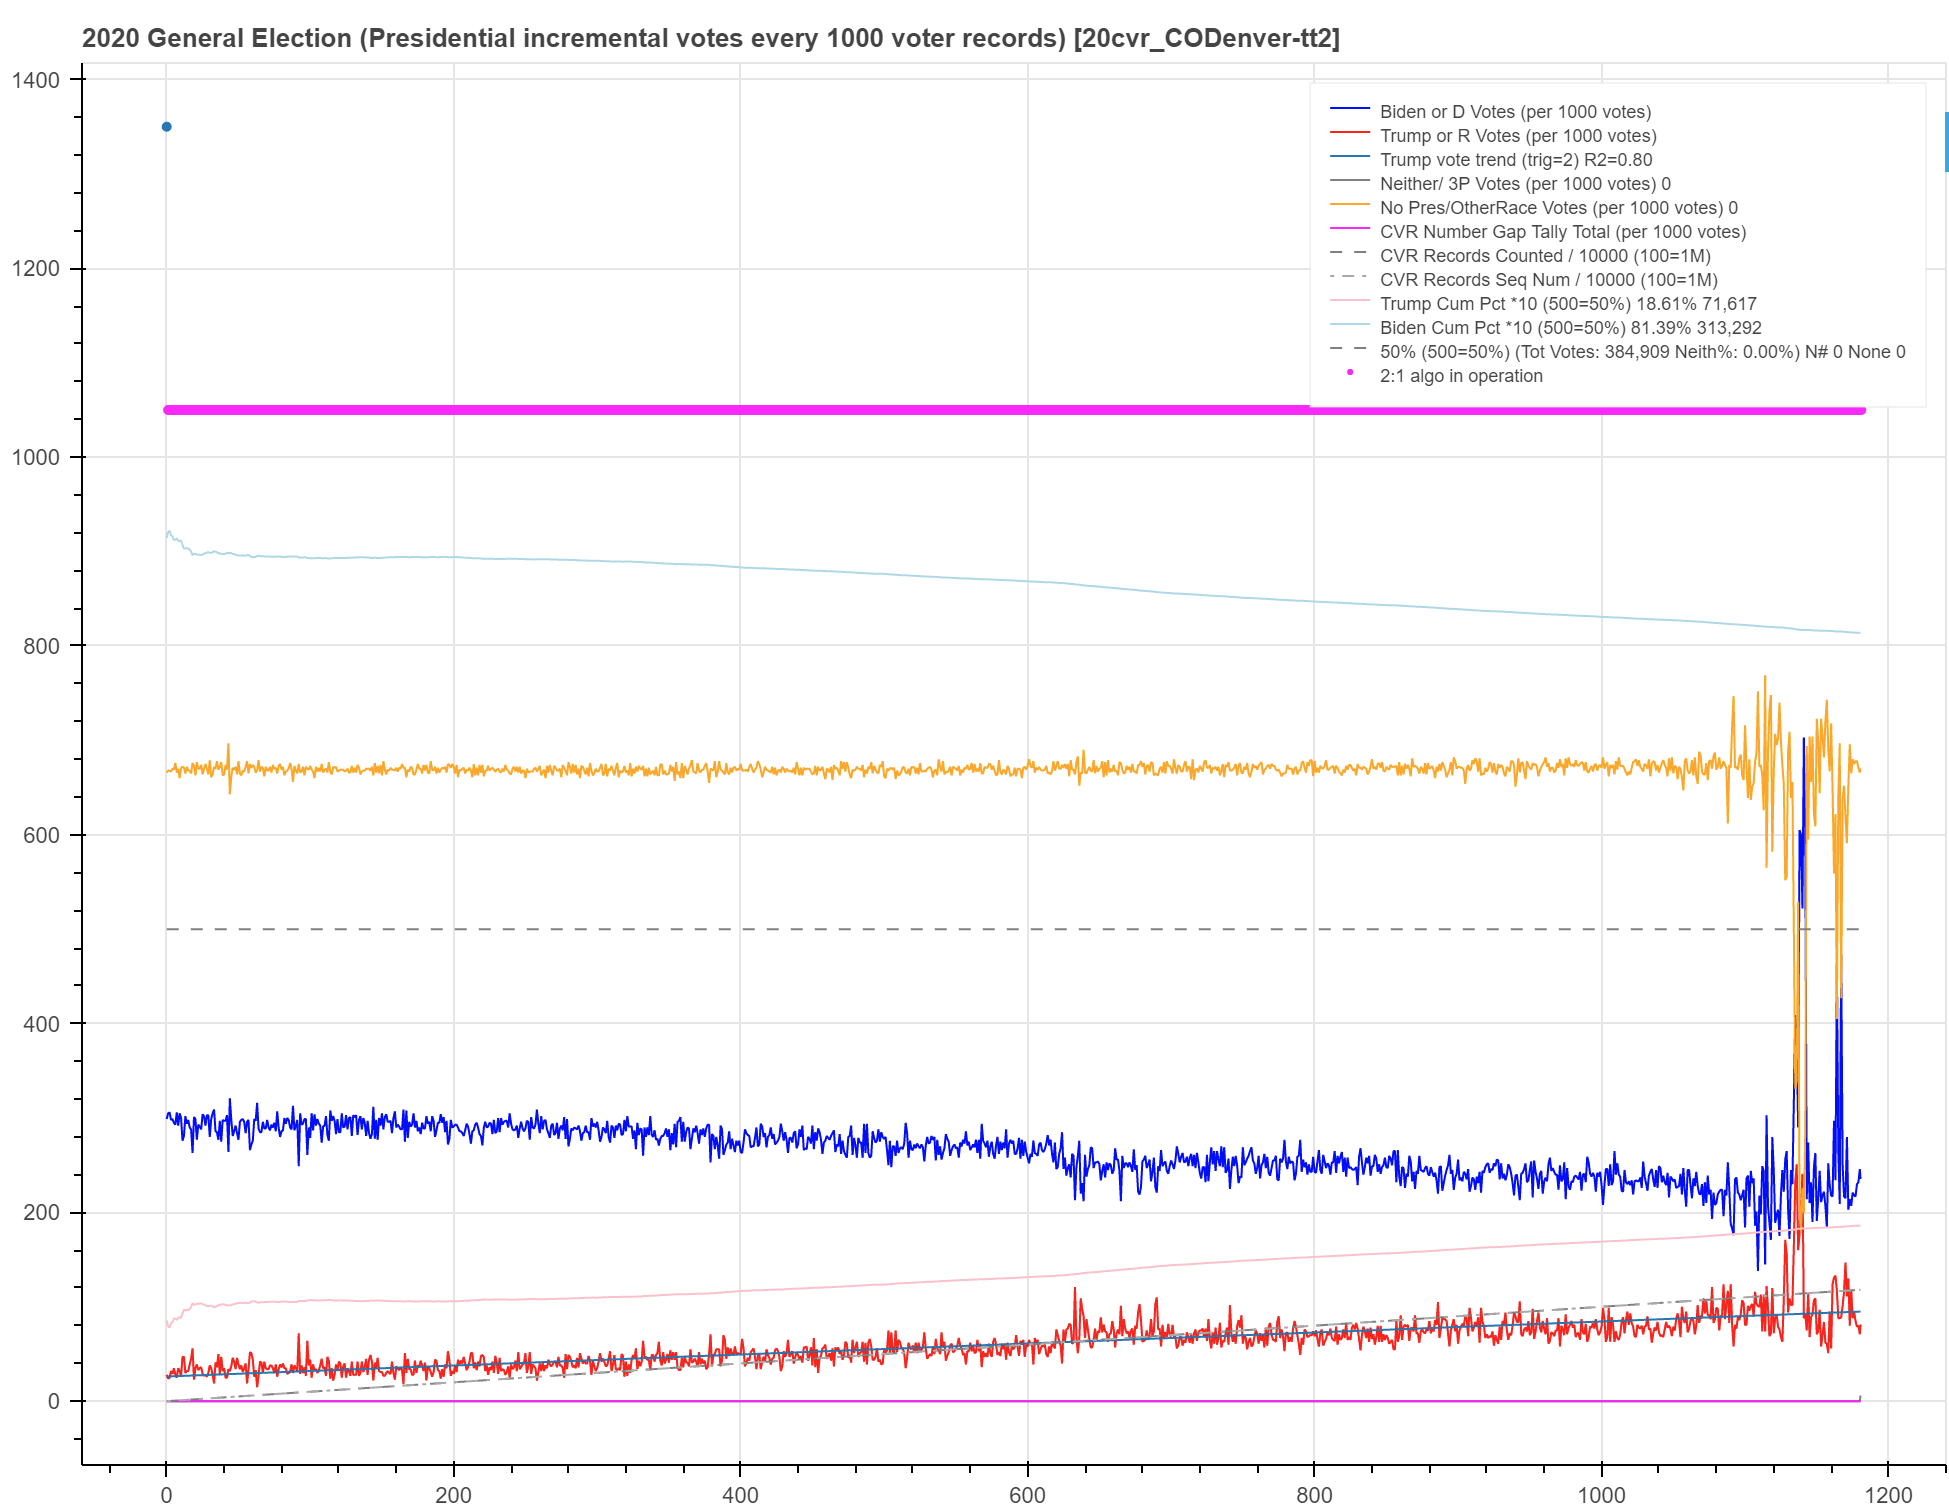
That’s right, where all the data leaks (failed post-processing coverups) in the 2020 CVR files I have seen so far are of a 2:1 selectable by algorithm / cast by algorithm “framework”, in Denver County, CO the framework is even higher at 3:1!!!
The simplest way to understand this is from either or both of two angles:
According to the US Census the population of Denver County in 2020 was somewhere below 711K and the number of votes in the 2020 Presidential election was less than 400K. That doesn’t seem unreasonable. EXCEPT: The official Denver County CVR file (of which the above is a sequential running “per 1000 vote increment” chart of) contains 1.18 MILLION records of votes (ballots)!1 So just off the top of the head math tells you that at least in the presidential race only around 1/3 of the cast votes in the CVR were used/officially reported! Inverse 1/3 and you get 3:1. (Go watch “2000 Mules” for just one example of how all those votes got into the the system — and purely synthesized vote records can’t be ruled out either given the iron grip the rulers seem to hold on the stored paper ballots themselves.)
If you look at the chart’s starting values for the lines you can even just eyeball that Trump (red) starts out getting around 30 of each 1000 votes, Biden (blue) starts out getting around 300 of each 1000 votes and ballots with no presidential vote cast (orange) starts at around 670 of each 1000! Each point along the X axis (red/blue/orange) is how many votes each candidate received of each 1000 votes cast which as you can see ends close to 1200 which represents 1.2 million!2 So for every 1000 CVR records (voters casting a ballot) only about 1/3 are casting (so they would have us believe) a ballot in the presidential race in Denver’s CVR file! Inverse 1/3 and you get 3:1. And note how the orange “no vote” line is flat as a pancake for almost the entire run of the chart! Expressing my sarcasm regarding the probability of such a chart signature — nvm the related math — would go on for pages so I’ll just stop now to keep the audience wide.
For the simple coup-de-grace we run a linear fit trend line through the Trump “vote” curve and get an R2 of 0.80! This is well into beyond belief territory and is yet another version of the “late Trump voter” deception I have explained in another post.
With a crazy large vote selection margin like 3:1 the algos can just basically draw straight lines (modulo defects and inefficiencies in their code) which is what they have done here! Compared to a 2:1 regime as I have documented elsewhere where Trump would have had to receive over 75% of the vote to win (overwhelm the algos), in a 3:1 regime he would have had to receive over 83%!
It’s unlikely that Trump would have won in Denver core city even in an honest vote — but the Denver County rulers weren’t taking any chances!
Since you may have a hard time believing the 1.18M figure, here is a screenshot of the end of the Denver CVR file. Note that both CSViewer (status line at bottom) and the file’s CVR sequence number column agree that there are actually that many cast votes in the file.
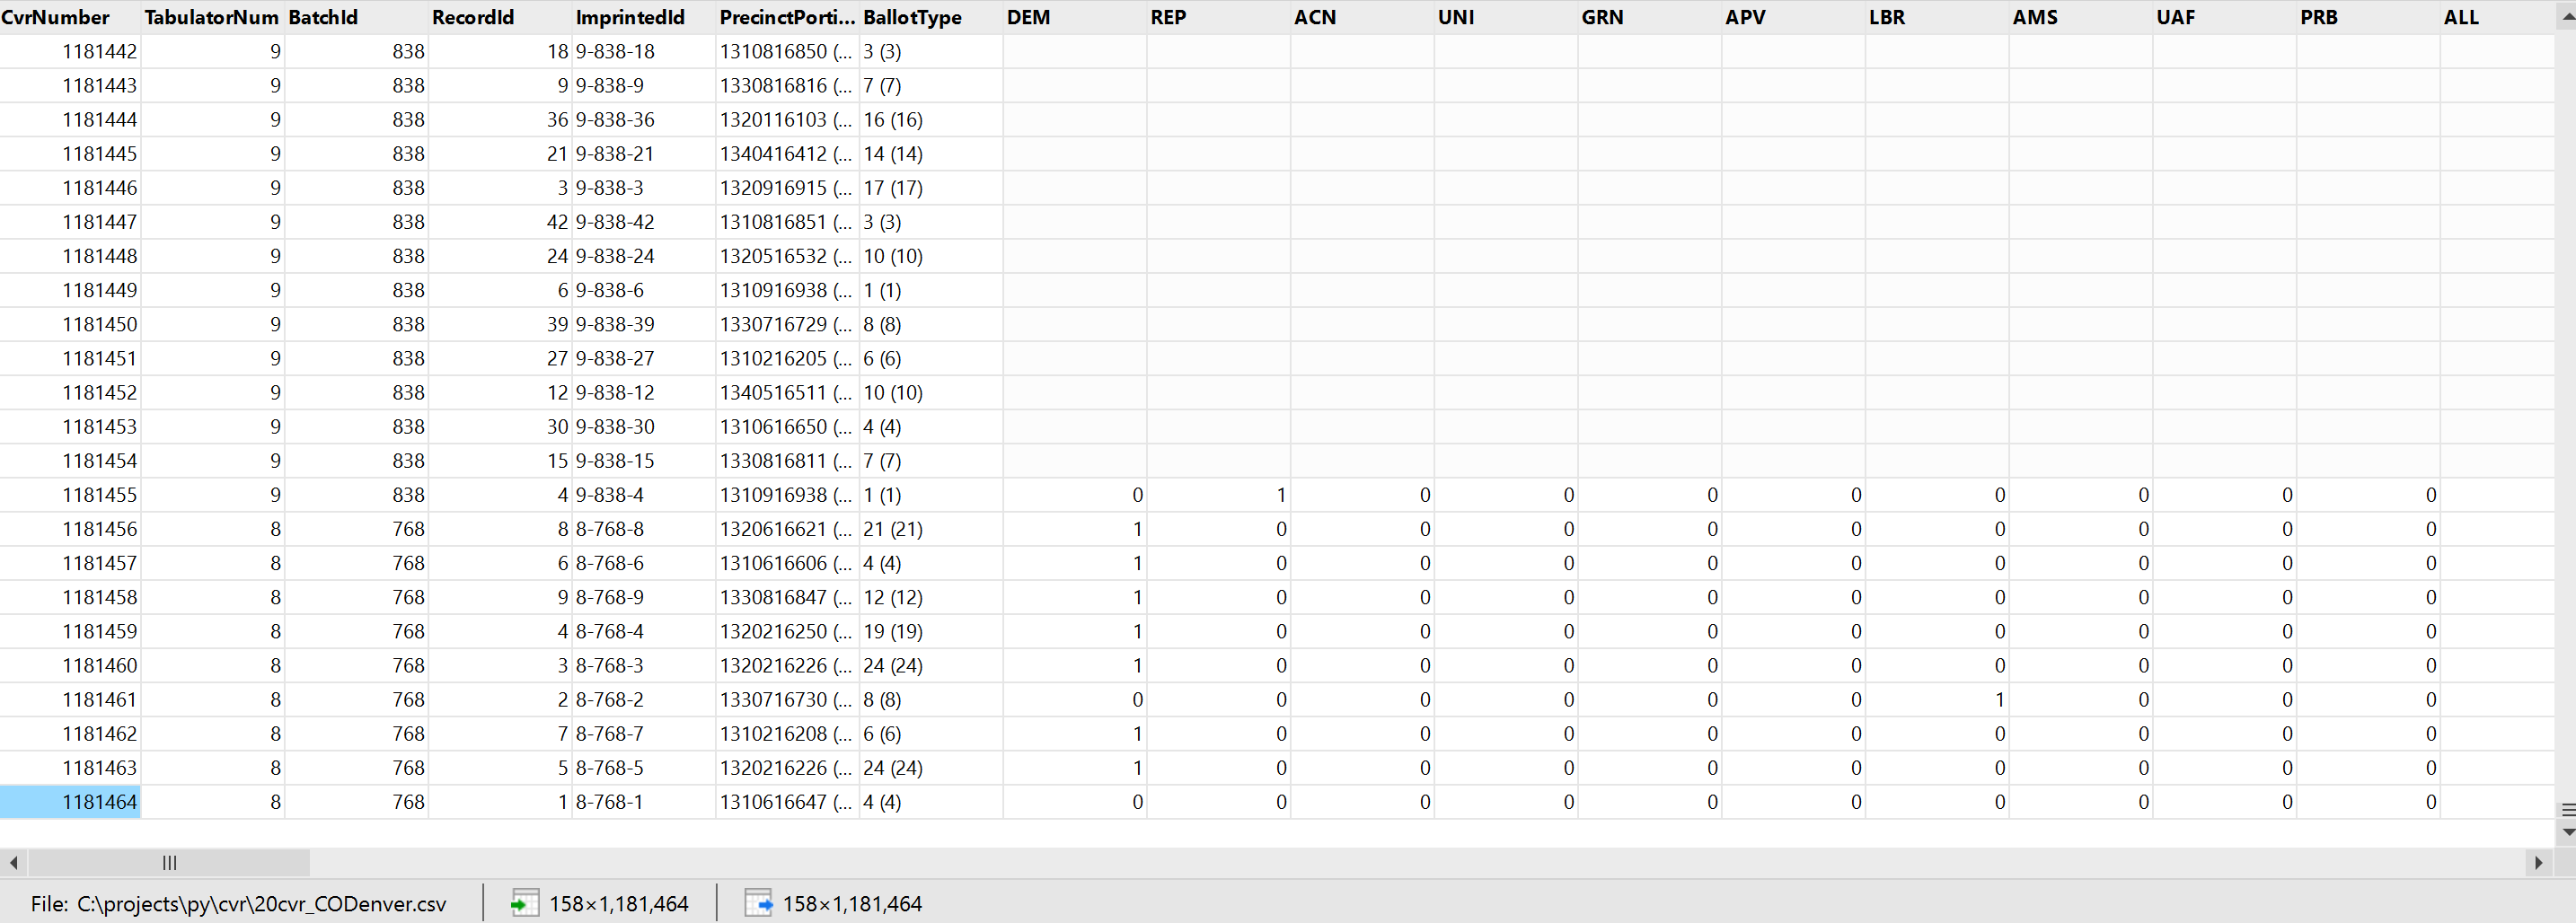
Also note that this snippet illustrates missing Presidential votes in the top half of the screen sequence! As I clarify in my Pasco County, FL post, if you scroll way to the right you will find that the Presidential missing vote lines do in fact have some strangely patterned votes in them for far down ballot races or initiatives so they can still be considered cast votes. And in fact this is one of two modes that the coverup failure occurs — they forgot to fully delete these records and then slap a new made-up CVRnumber sequence in the first column that would then end at under 400K votes! The other coverup mode as exhibited in Clark County, NV is that they do delete these “no Presidential vote” lines but forget to re-sequence the first column CVRnumbers so they end up with gaps in them and the ending sequence number would still be 1,181,464 in this case but there would actually only be <400K lines (records) reported down on the CSViewer status line! In Clark County’s case there were less than 1M records but an ending sequence number around 1.4M (of a county population of 1.8M — not insane like Denver or SF but beyond credibility).
1000 times 1200 is 1,200,000