
2020 Vote Manipulation in Pasco County, FL
2020 Vote Manipulation in Pasco County, FL
A quick post for those that are interested... (Updated 220717 early afternoon)

INTRO NOTE: This post is currently pretty rough since I wanted to get it up quickly. It will be updated and it is the first of many related posts I have forthcoming (new 220717 update at the end adds a chart version with my updated code so we can see valid cumulative percentage lines which turn out to be “interesting”).
I was posting on Lone Racoon Chat and got kicked off for this post as too intimidating for the audience. You can read it yourself and see if you think so also. (It sounds like Racoon may have time to look later as he is focused on other things though currently — I wish him and Draza luck in their current work!)
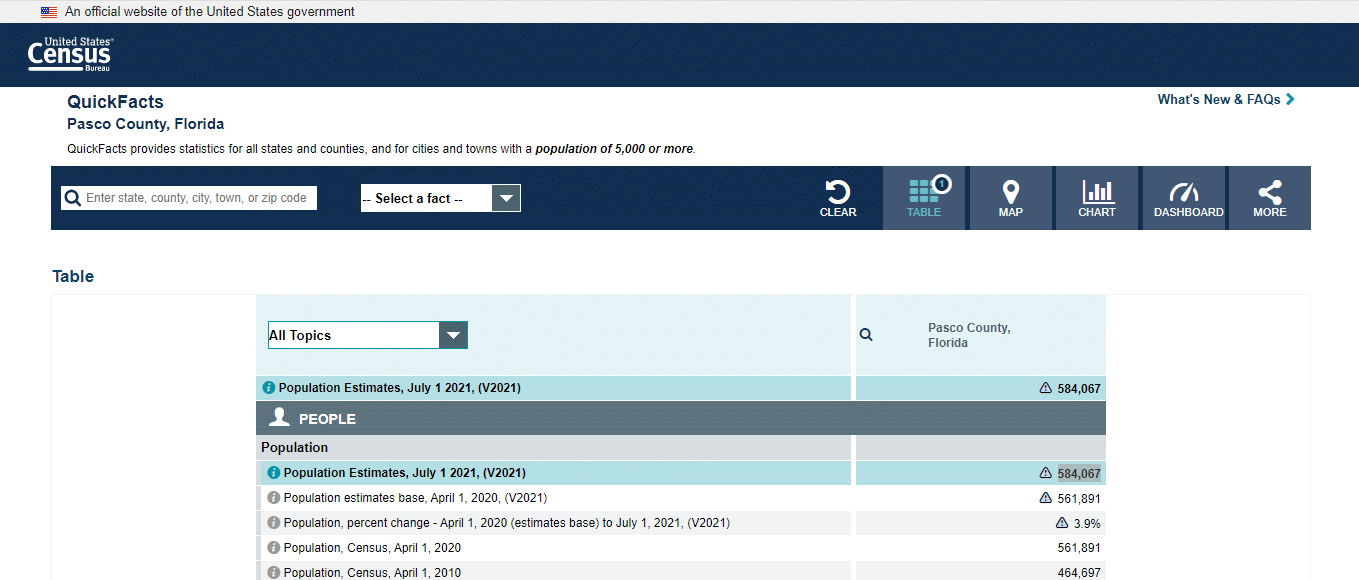
It turns out that the population of Pasco County is just shy of 600K even in 2021:
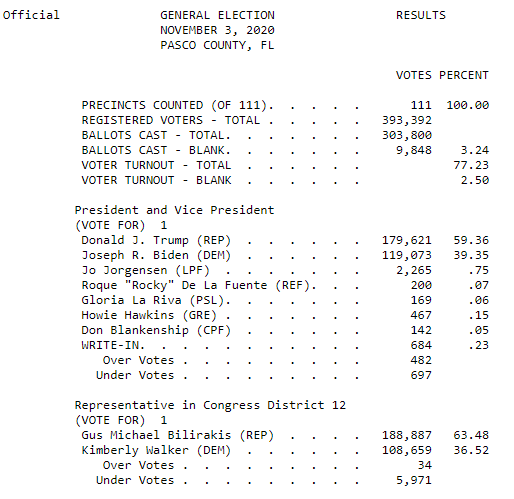
But it turns out that there were over 600K votes cast by CVR sequence:
Hmm. It looks like at the end the CVR numbers (first column) are all sequential. And everyone cast a presidential vote — so how did the total number of votes for President end up at only around 300K?
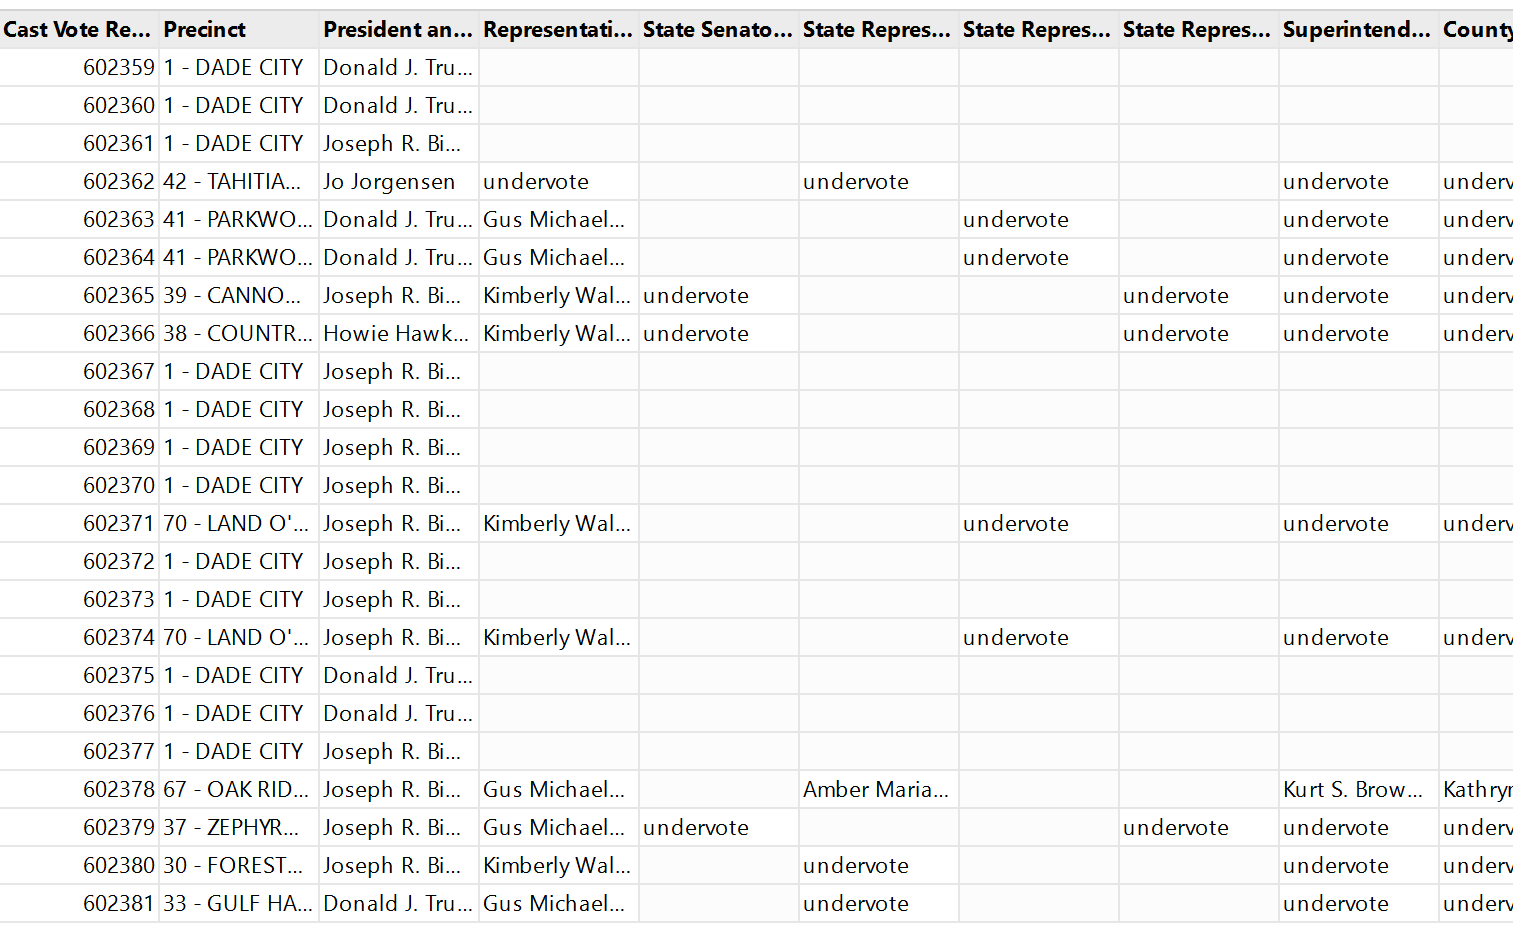
Well, if we look at the start of the CVR records we find this:
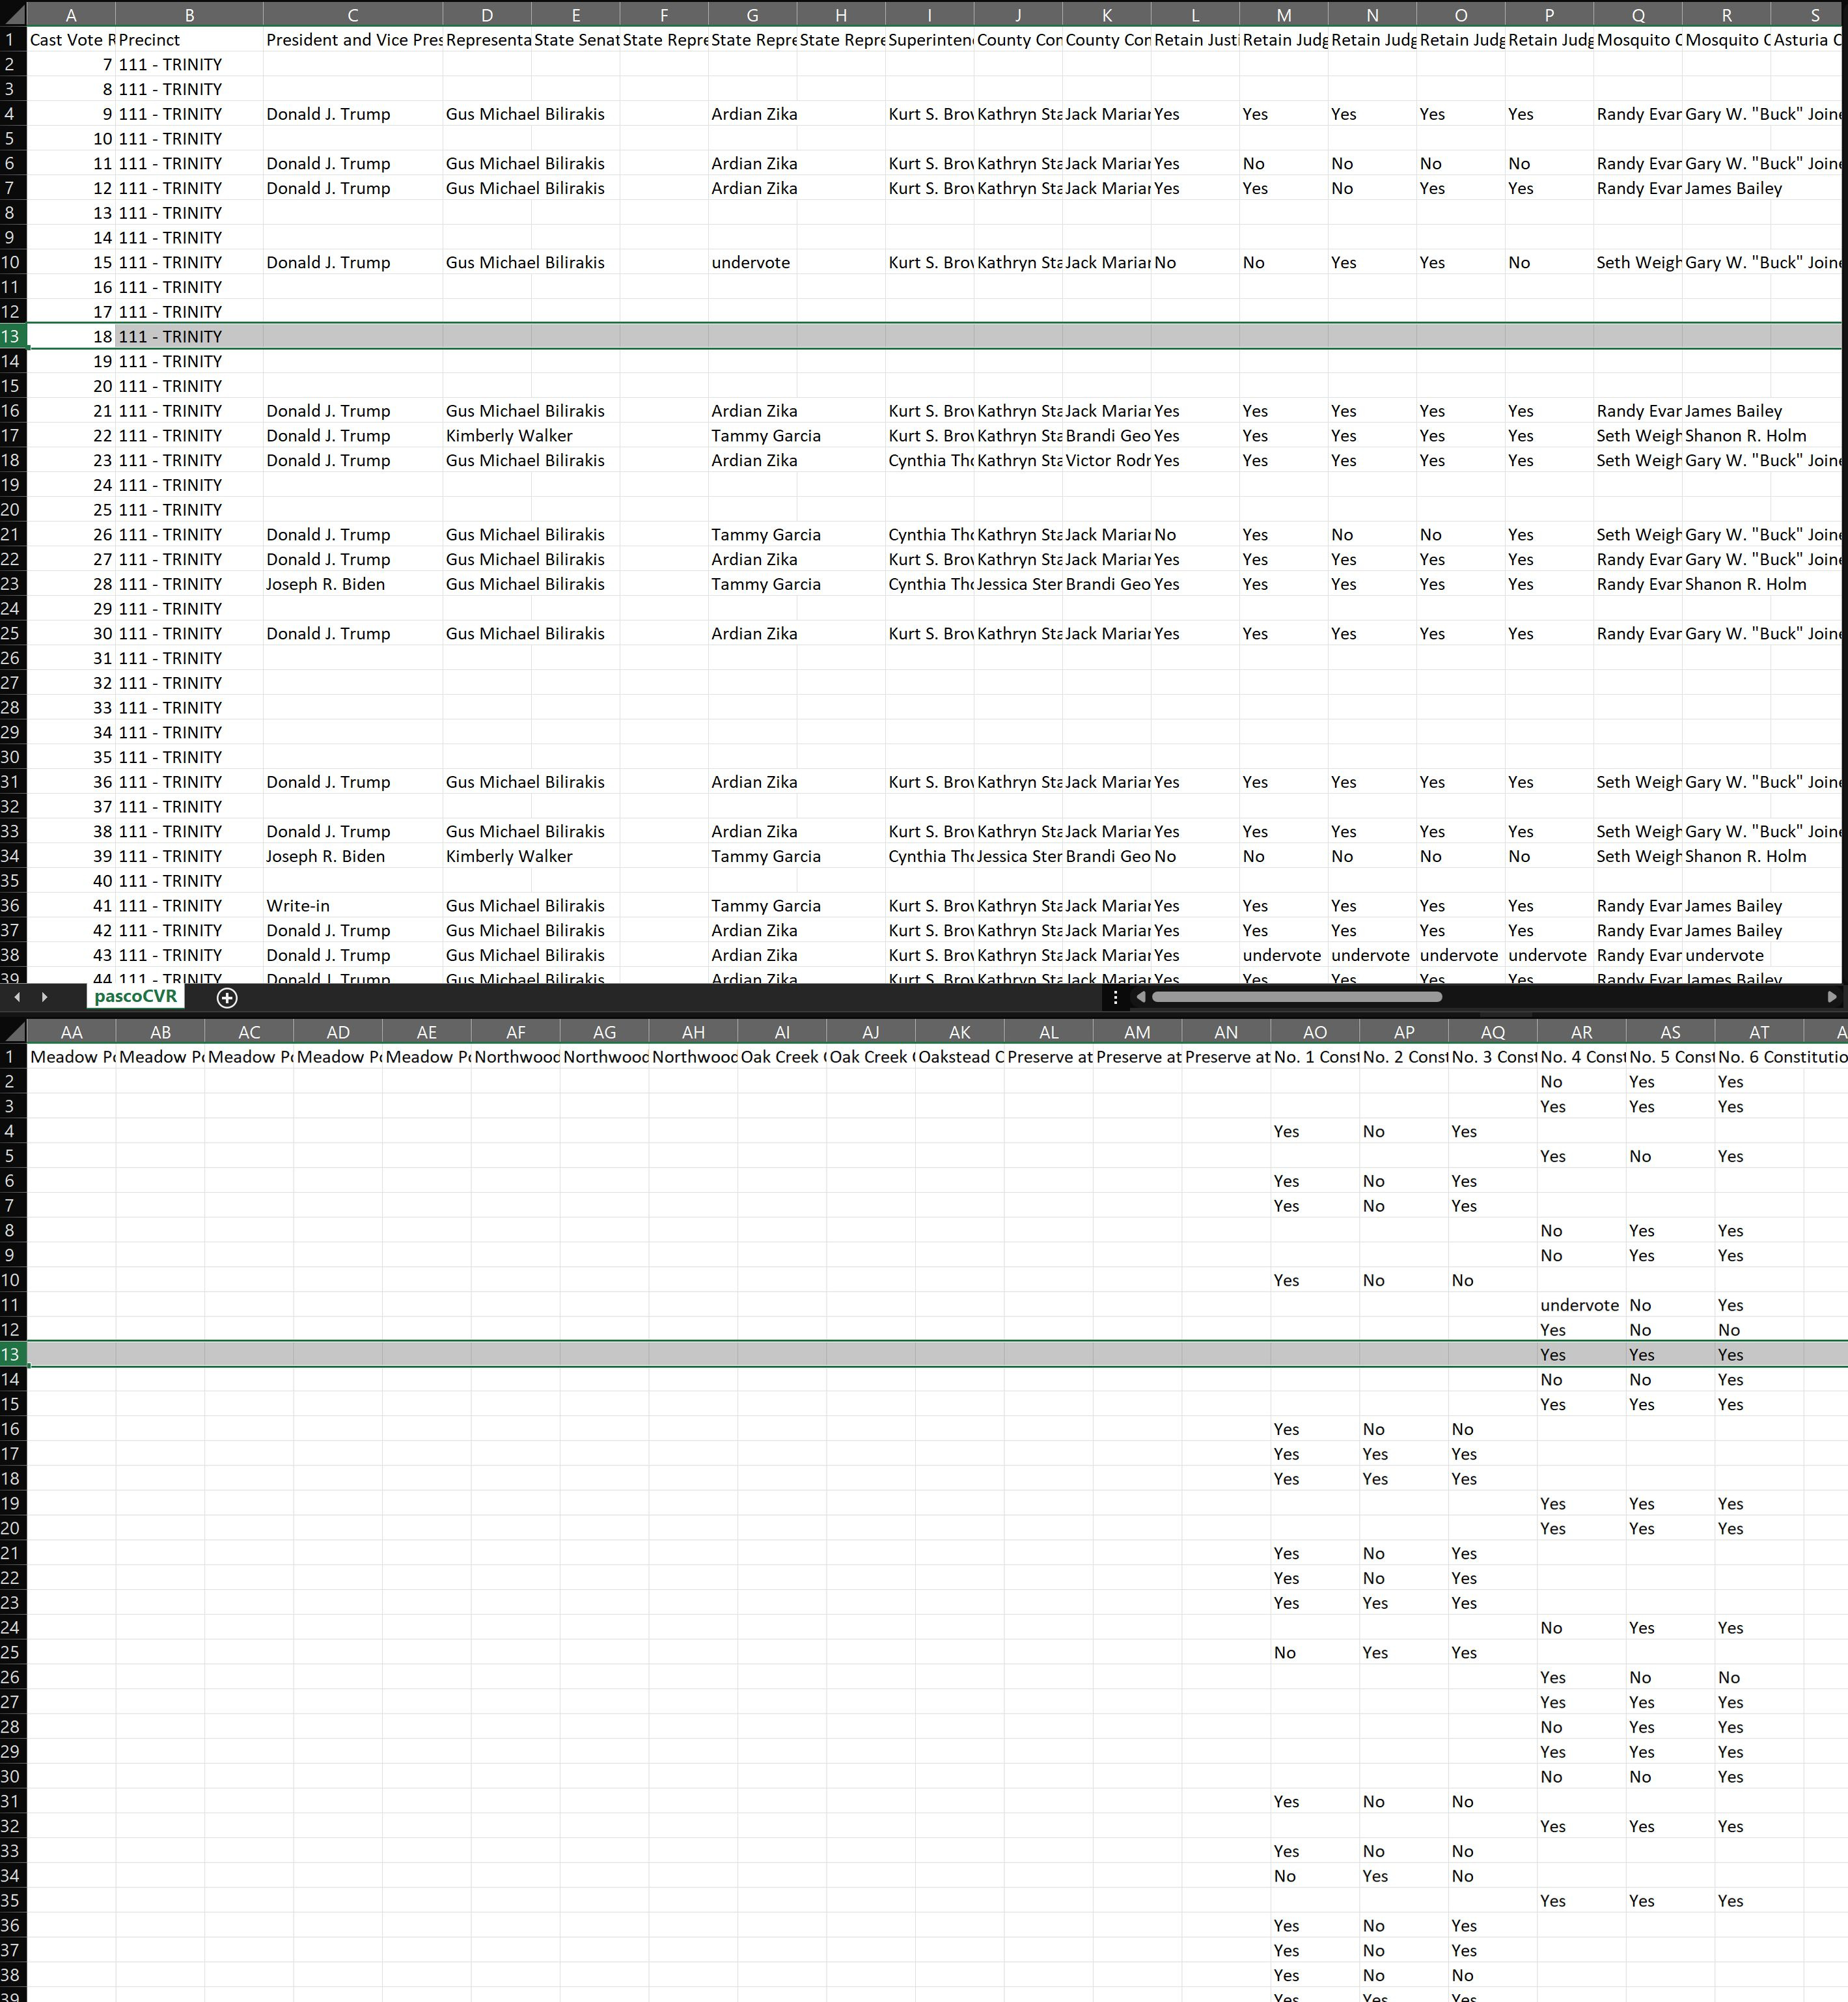
Note that while the CVR numbers are also sequential at the start (and it turns out throughout the entire file) we find that about half the people chose not to vote for the upper races like President but did a weird splitting of their votes entirely between some end of ballot constitutional amendments! (Bottom Excel view is the ends of those CVR rows in the top grid.)
Huh. Let’s just say that never happens in real life.
I had previously done some very interesting analysis of Clark County, NV that I will show a version with annotations here just to introduce you to my current CVR file charting capabilities (don’t dwell on it if you can’t understand it for now).
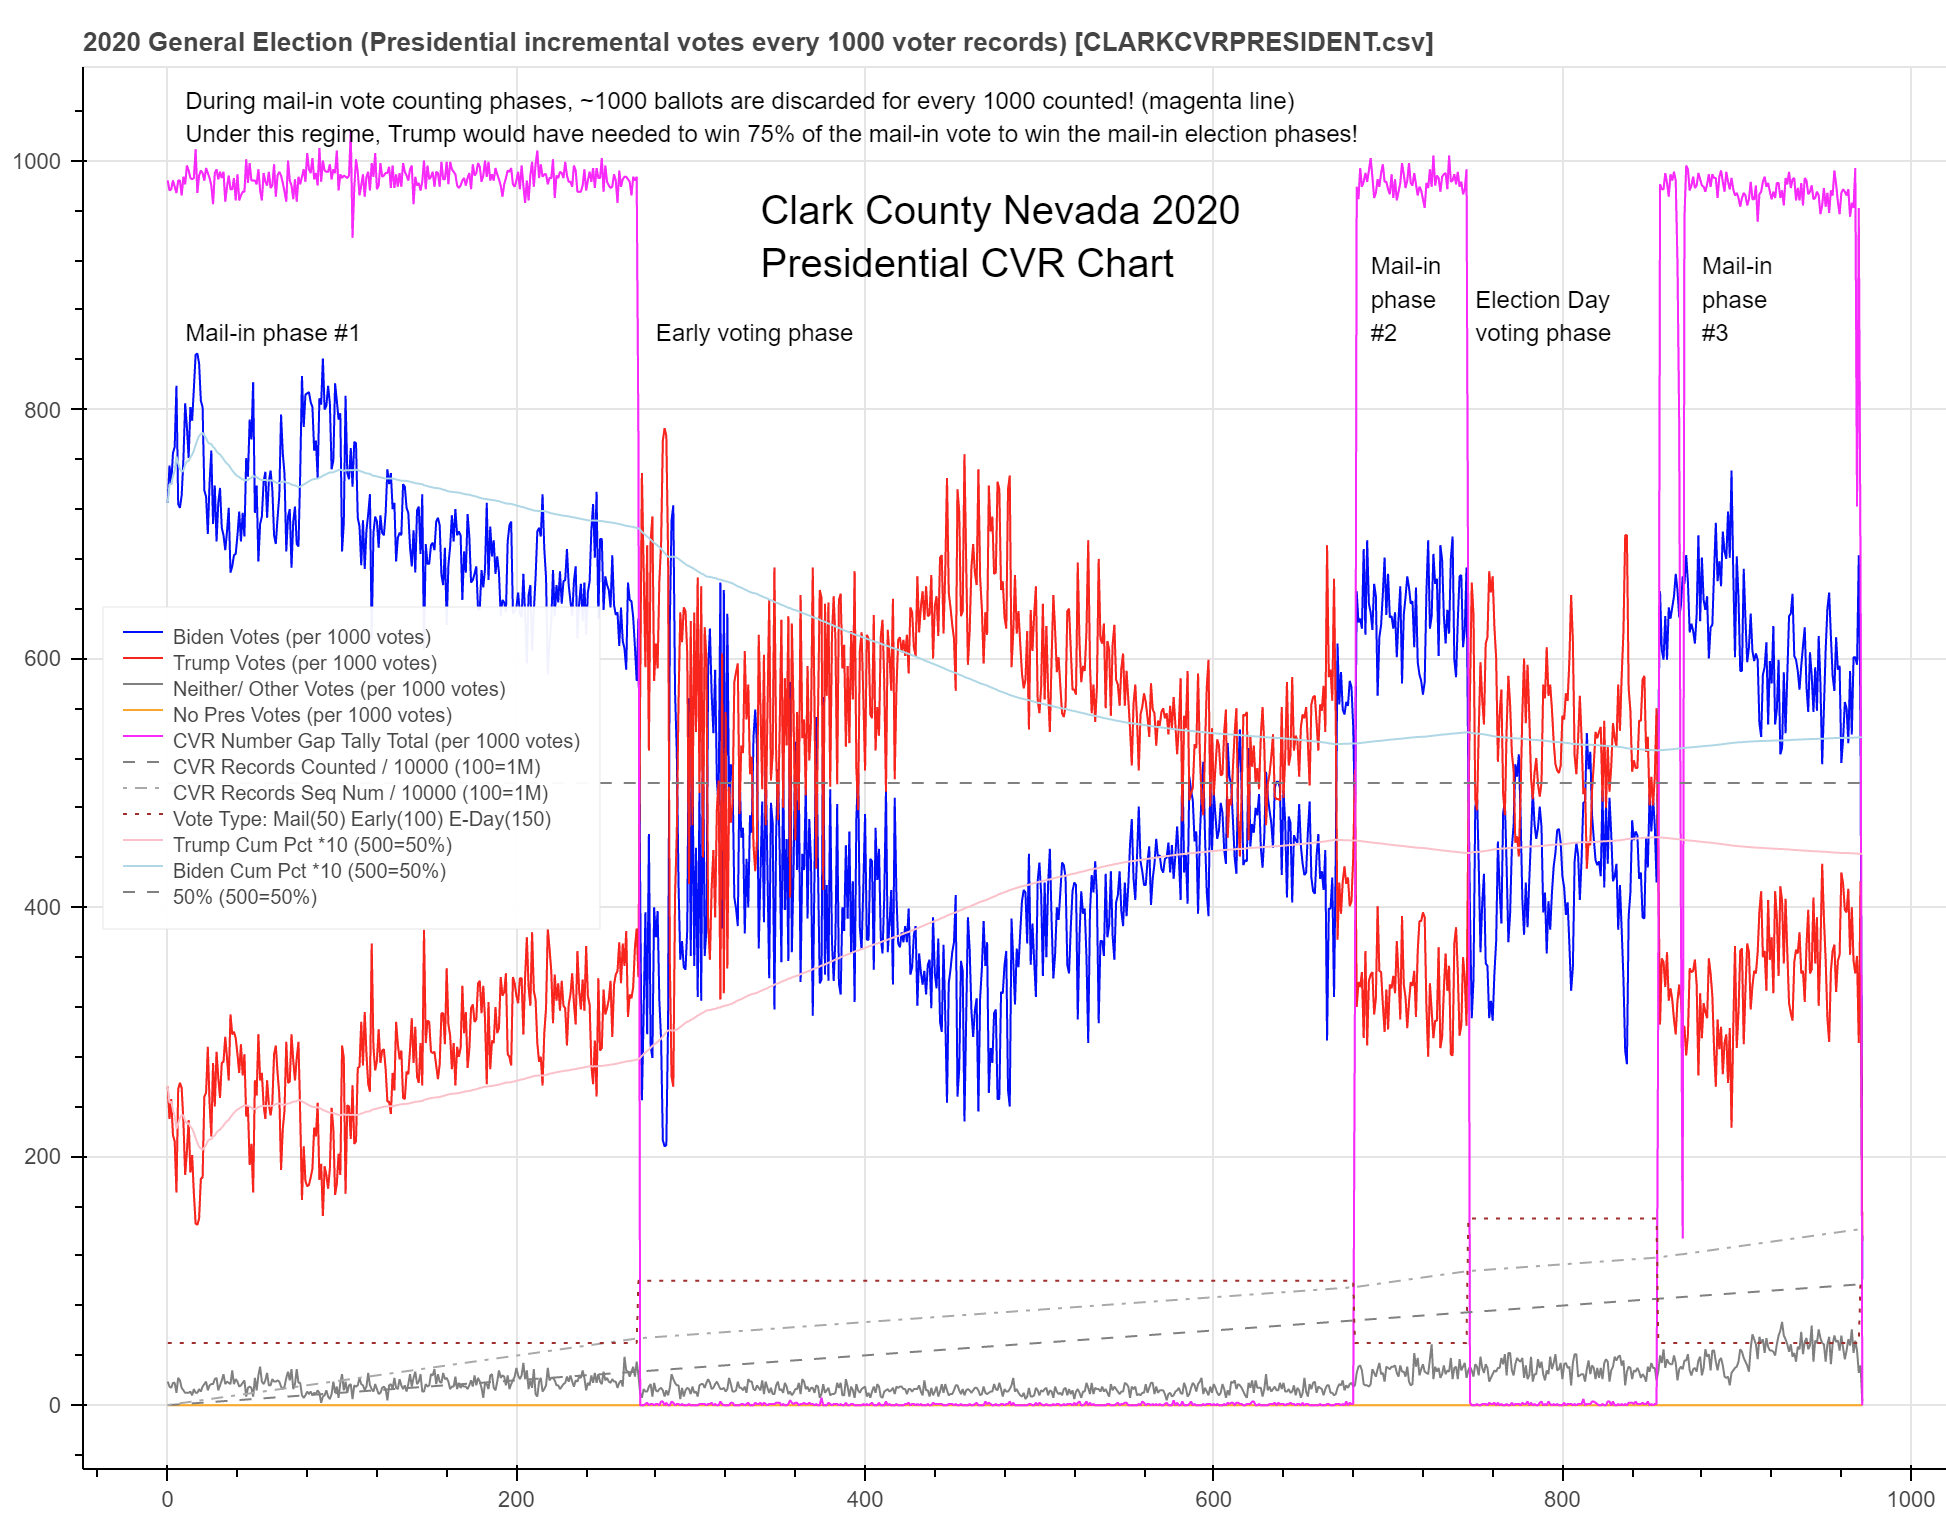
A hint about what’s going on is that the elevated plateaued magenta line of CVRnumber “gaps” being correlated with “Mail-in” vote counting is not a coincidence and is just another version of what I am about to show for Pasco.
UPDATE: But before we move on there is something important to know: those magenta “plateaus” are created by the Clark CVR file having “gapped” CVR numbers. That means instead of the CVR number sequence going 1, 2, 3 … it goes 5, 7, 9 or whatever for the length of the file (this was a “mistake” by the operators producing the CVR or a defect in the ES&S software — think of it as a rare peak behind the “wizard’s curtain”). What I do with the purple line is to take the derivative of such a gapped sequence and count how many numbers are MISSING. So to see the magenta line run plateaued near 1000 during mail-in ballot counting means that for every 1000 CVR records I count there were also nearly 1000 ballots (a total of 2000) that those 1000 records were selected from! So the basic math on that is that for Trump to win against such a framework he would need to get over 75% of the vote! And he was actually flirting with that in deep red Pasco County — only it exhibits in a different way (as “no votes recorded’s”) since I have decided not to update my code to do this type gap counting under a sequential numbering scheme yet so we can see yet another interesting chart type…
Anyway, here is the Pasco chart:
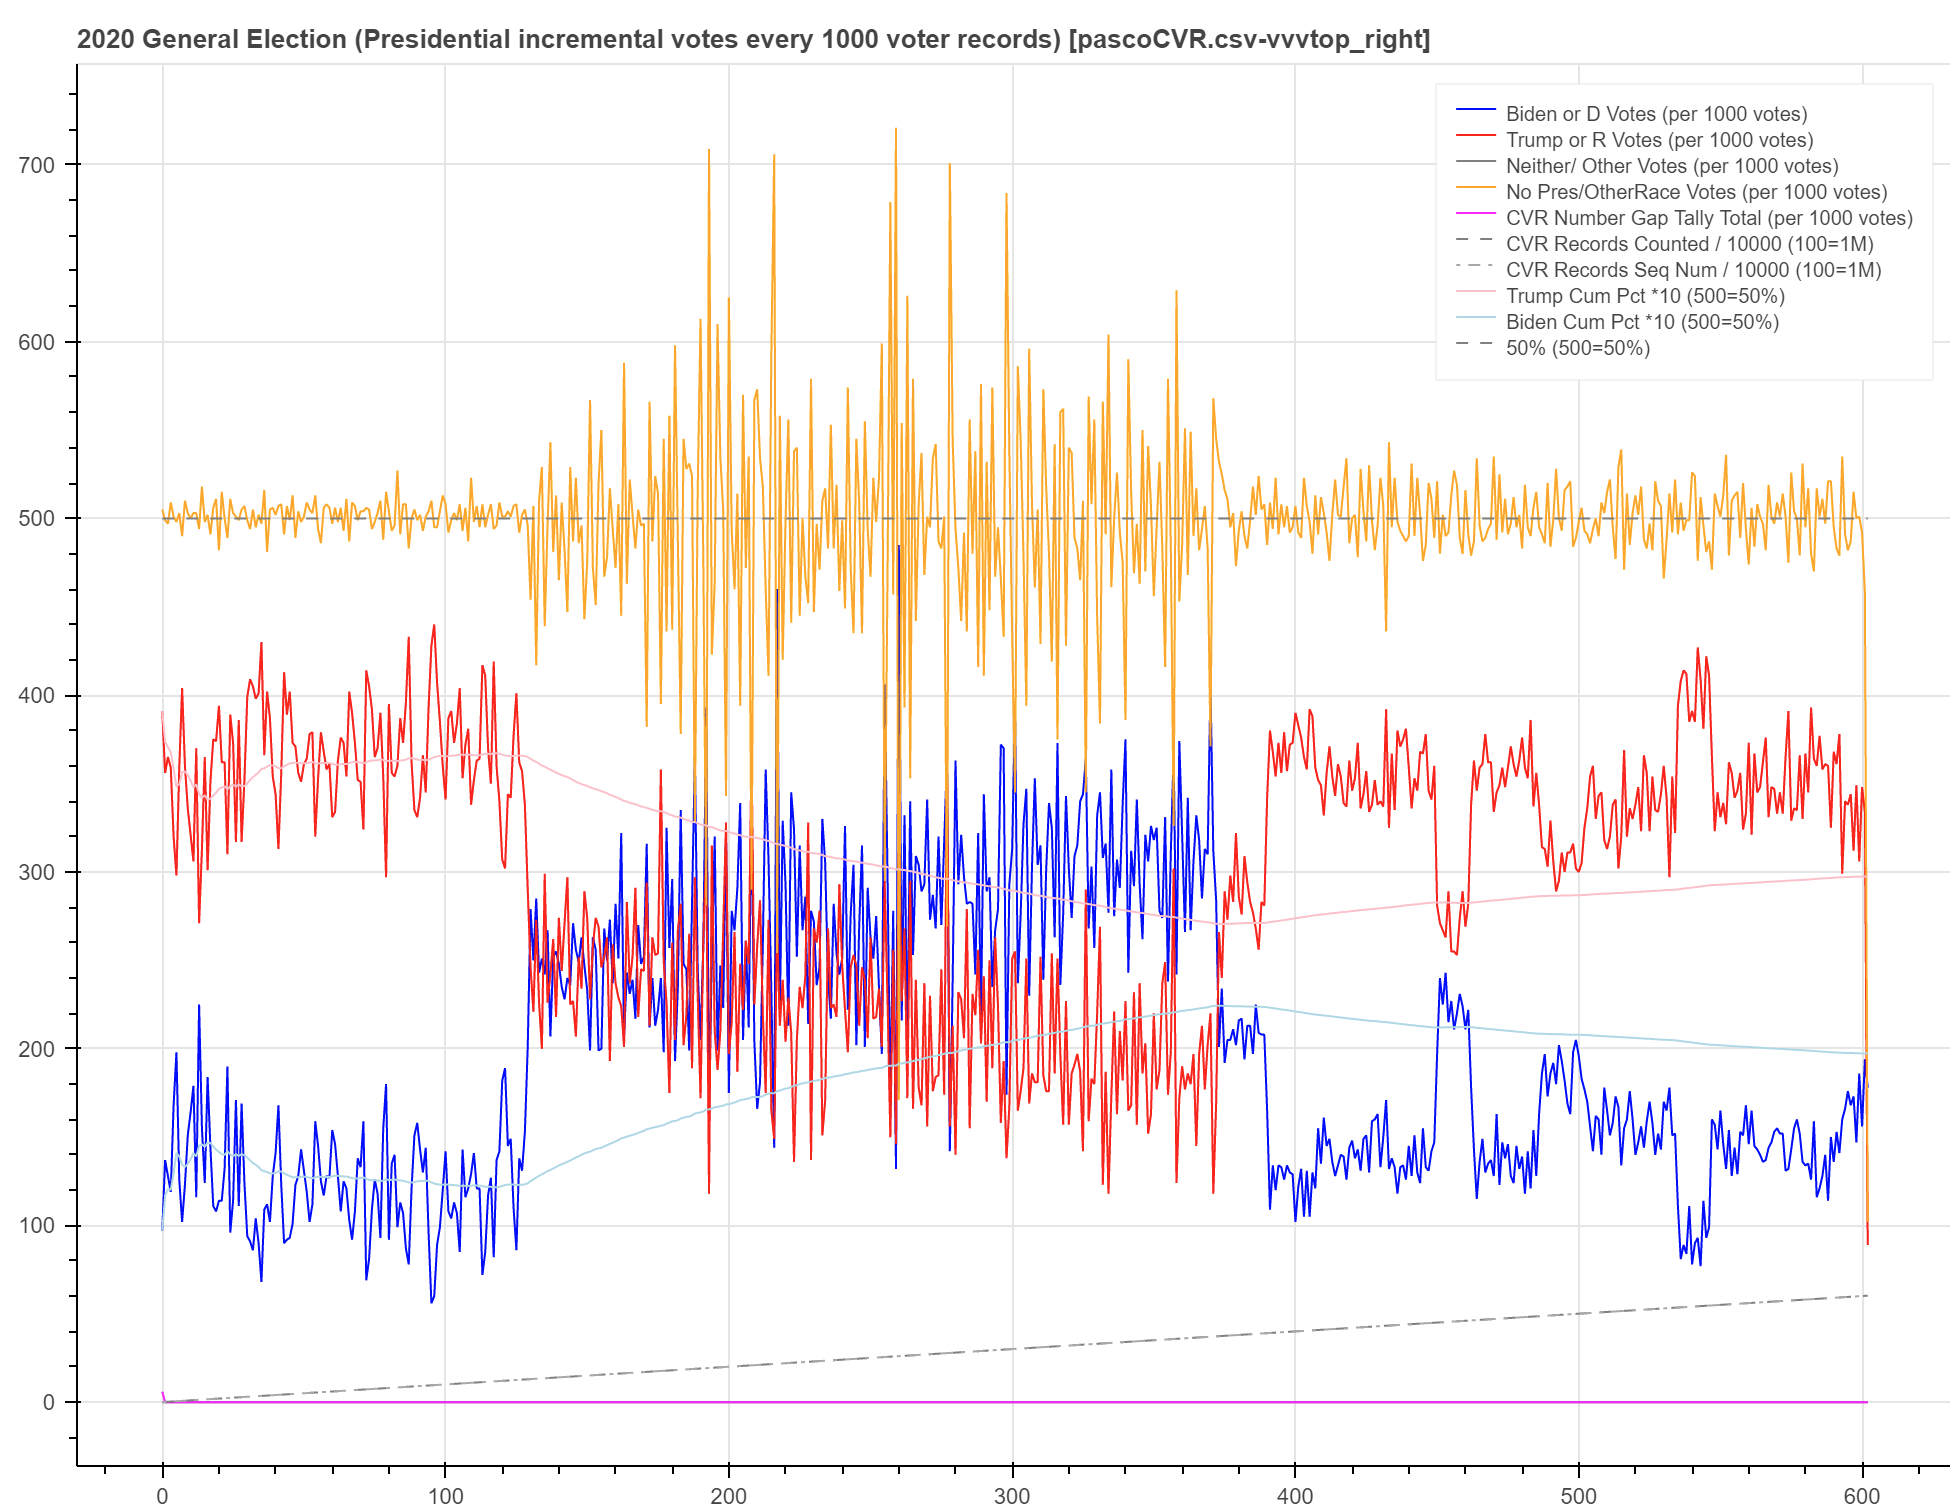
So what happens to my charts in this situation (since I had not encountered candidate vote gaps in sequential records in any files before now) is that these “no presidential vote” “gaps” get thrown into the “No Votes” orange line and the number of votes for each candidate per 1000 votes gets roughly cut in half! (Also, the votes per 1000 number divided by 10 are the percentage of the vote for each candidate during those 1000 votes of which there are 600+ points along the X axis for the 600K+ CVR records.)
So now the punch line: What do I think is going on here?
I think the “blue team” controllers of the voting machines in Pasco realized that Pasco was deep red and would have a very high Trump vote total so they knew it would be a foolhardy giveaway of malfeasance to have Biden win this county due to their algorithm.
But they had to shave some votes to try to win FL overall for Biden so a little way in they kicked in their algos. You can see that by the complete pattern change about a quarter way through the chart.
At that point they slowly put Biden into the current lead for each thousand votes counted (though not the cumulative lead as shown by the pink and light blue lines) and at a certain point decide they have shaved all the votes they can get away with (and can’t have Biden win in Pasco or they would draw too much scrutiny!) and they shut off the algo again. The end of the chart is very similar to the start though not exactly the same and they are probably still pushing some additional votes to Biden.
The fluctuation in the orange “no votes” line turns out to be a proxy for how hard their algo is working. Their algo is clearly in distress here as it gains ground with Trump drawing 70% ish of the vote as the honest baseline (with 50% votes lost off the top that means that running around 350 (/10*2) is about 70%)!
Also, this chart (as is to some degree the Clark County, NV chart above) is a refutation of the first level fake story told in many places like CO of the “late Republican voter” election day surge (update: I have added a CO example chart of this below — notice how the blue is clearly in the lead from the start and then red finally starts to win incremental 1000 vote tallies at the end). Notice how flat the high % voting is for Trump right from the start in Pasco and then to the end! (Hat tip to Geri’s dogged concern about the law of large numbers at Racoon chat.)
This needs more development but seems awfully close to the likely real story to me — tell me where I’m wrong ;) And how I wish I was wrong…

220717 Update:
So when I update my code not to throw blank votes into the “Gap Tally” line we see this:
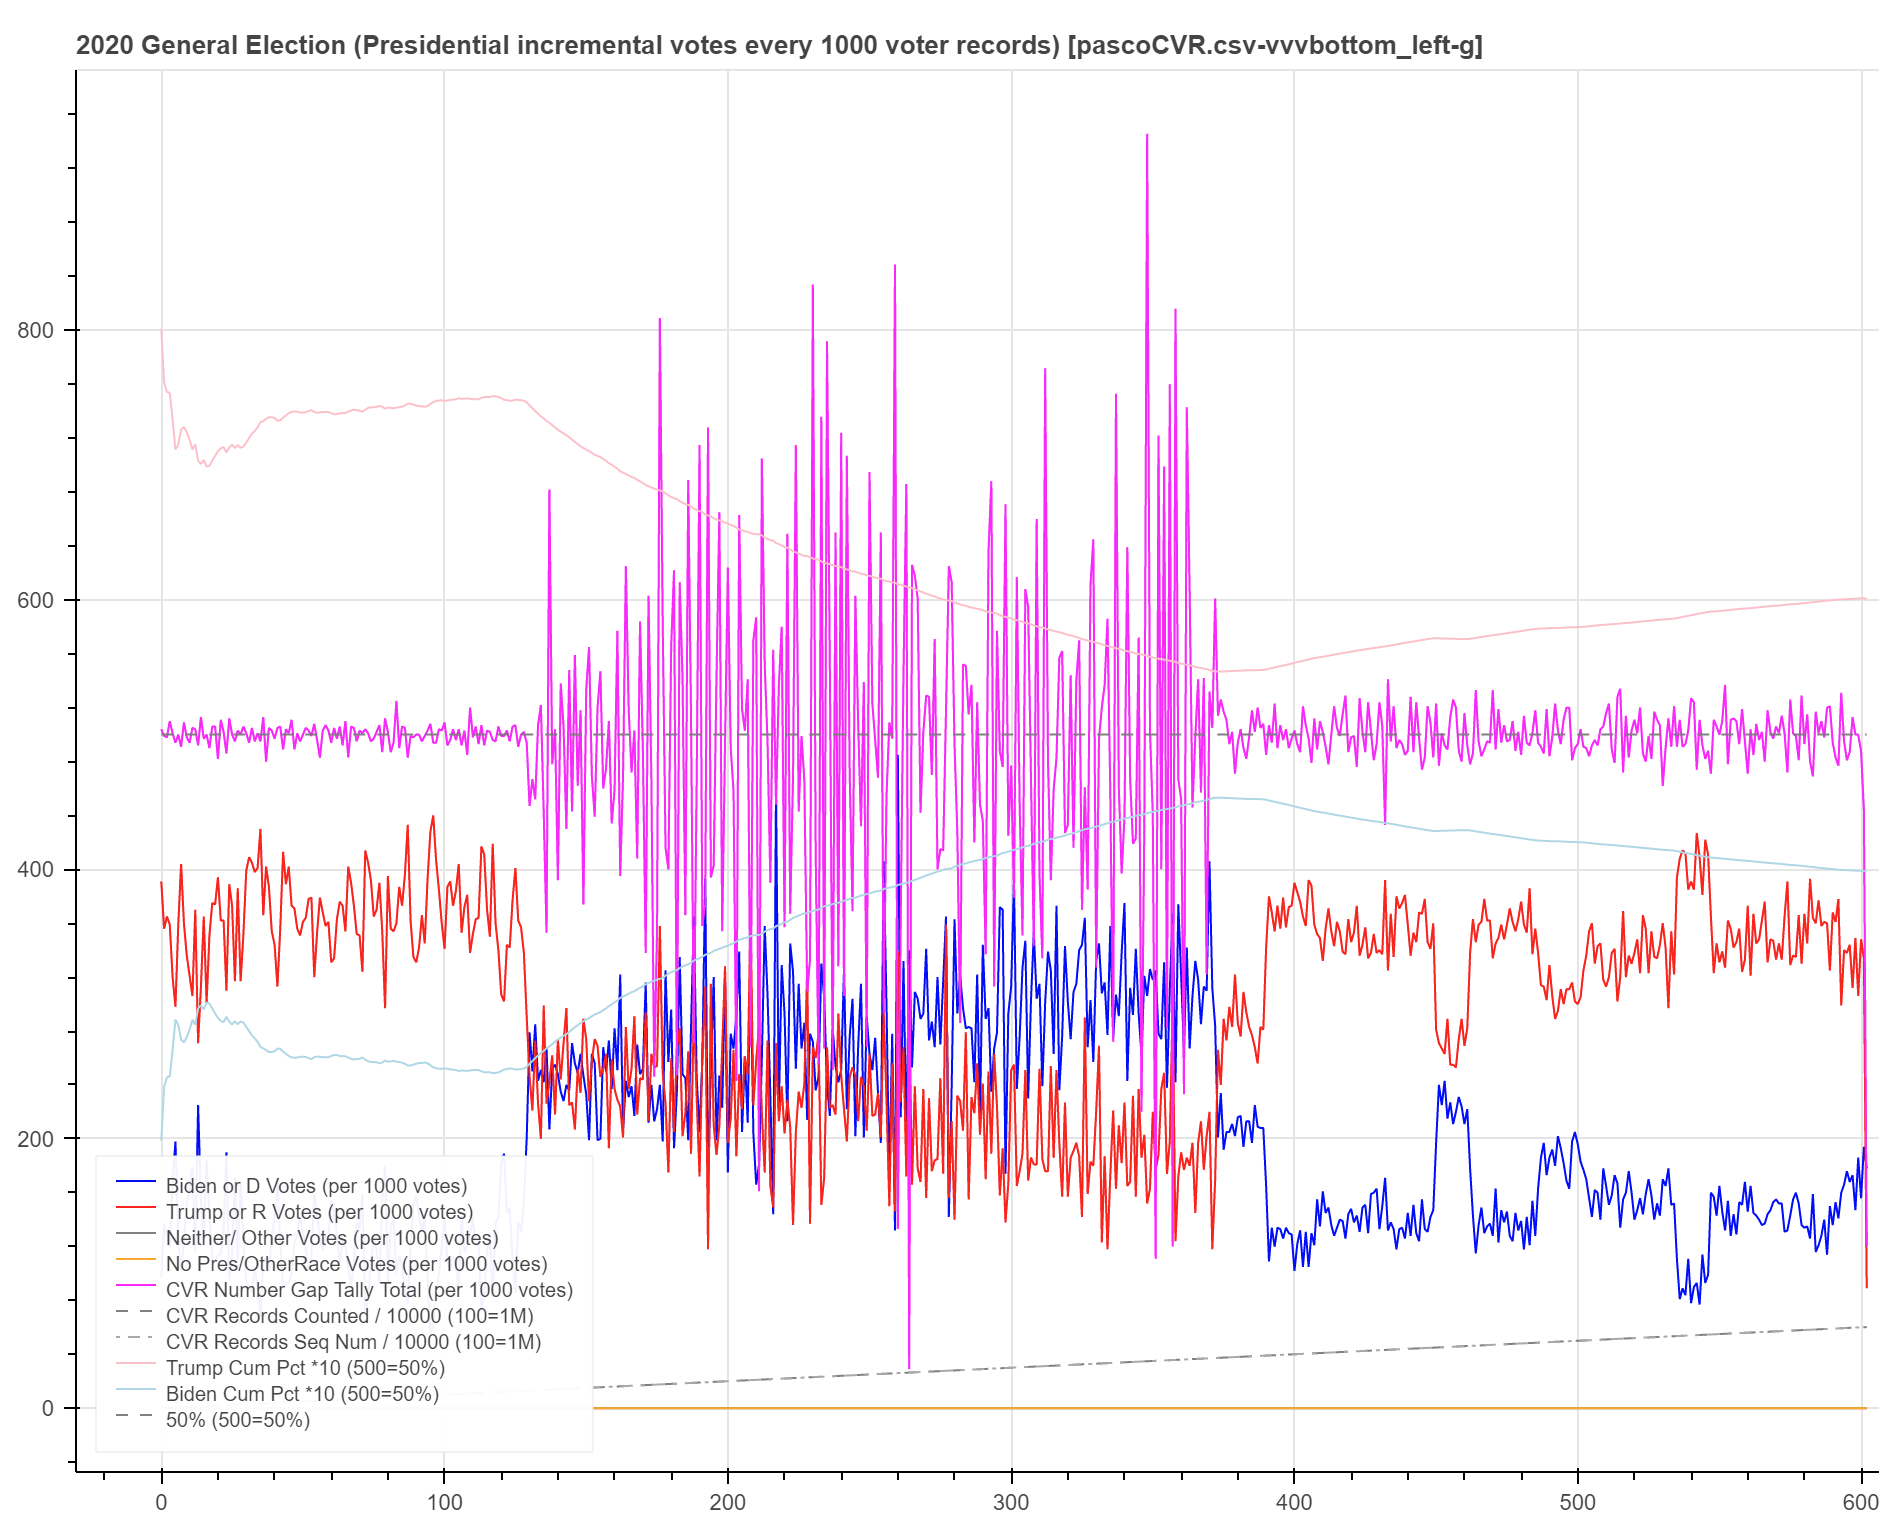
Now the “gaps” are shown correctly in the magenta “Gap Tally” line and of course we still see the same patterns. But now the light red and light blue running cumulative percentage lines have their correct values (divided by 10 so 800 = 80%).
What’s particularly interesting is related to my previous theory that they can always win the mail-in vote as long as Trump’s vote percentage stays below 75%. If we zoom in on the area where the algo obviously kicks off we see this
Oh my. Shortly after the (light red up high) Trump cumulative tally nudges above 75% the algo kicks off and drives Trump vs Biden votes to the 50/50 level as a first step (50% = 250 on this chart) before starting to pull Biden into the lead.
Keep that 50/50 level in mind for my forthcoming post to be titled “Oscillating Osceola” ;) …