
Oscillating Osceola
Oscillating Osceola
A follow up to my post on Pasco County, FL

So applying my charting code to Osceola County, FL yields this bad boy:
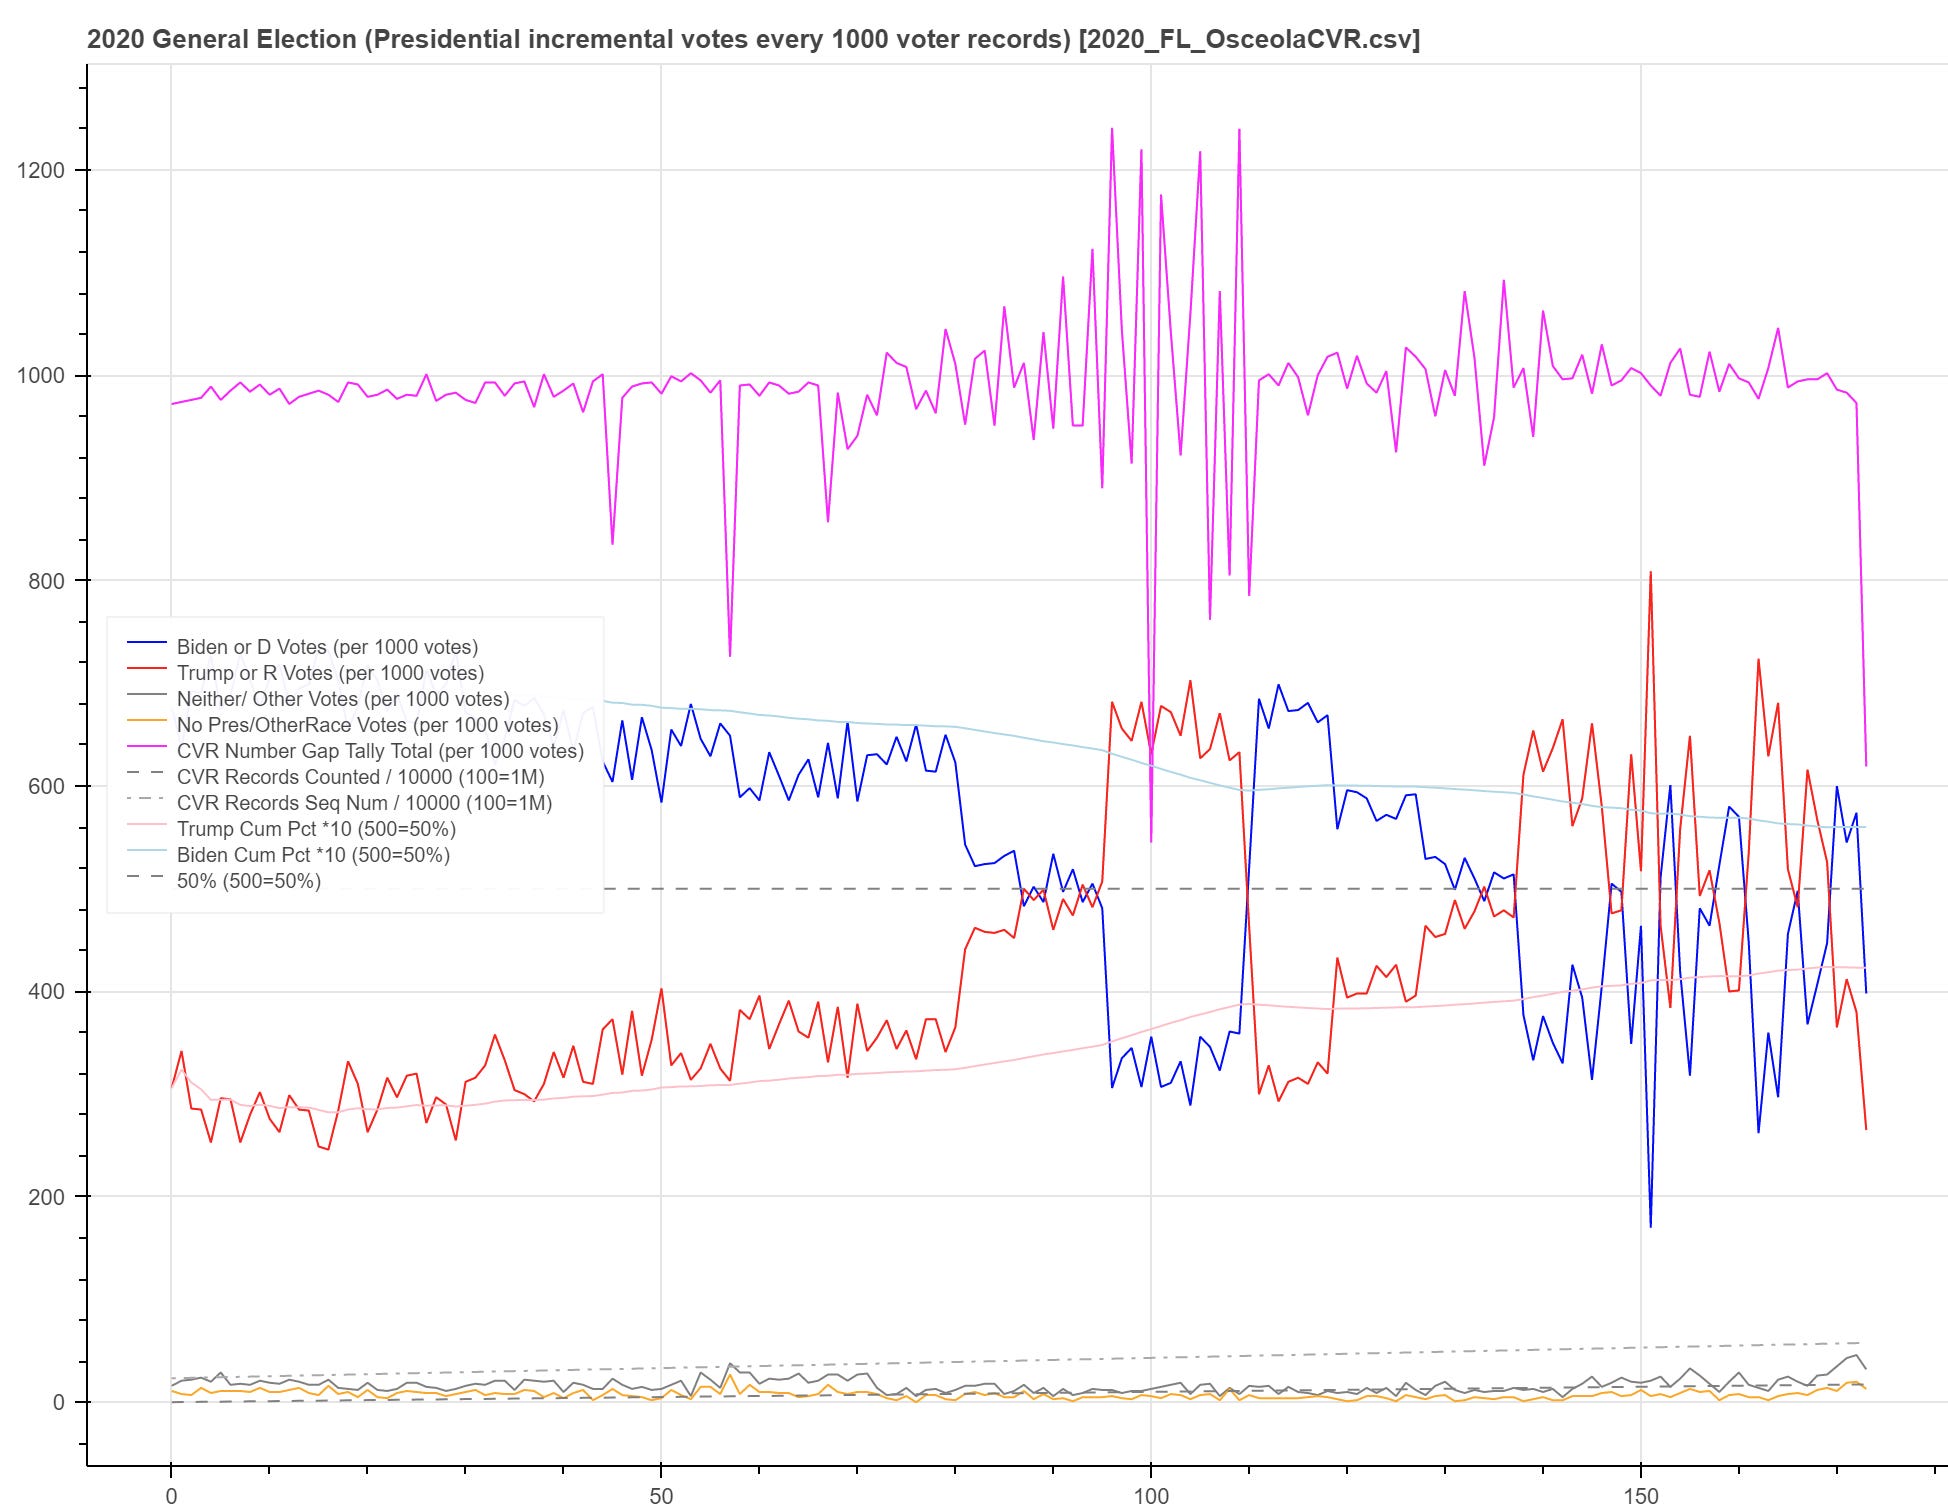
After running their “late Trump voter” algo for half the counting they kick in to a mode that first stabilizes for a while at 50/50 as we saw in Pasco but then they finish the election with what could be called an unstable somewhat rail to rail oscillating PID control with only perhaps a hint of the earlier late Trump voter mode from 115K - 135K votes.
While my derivative approach to looking behind the “wizard’s curtain” showed surprising success in Clark and Pasco counties, in Osceola it’s harder to determine what the true Trump percentage of the vote likely was. My best guess is that it’s the red burst starting at 95(K) which looks to be in the mid-high 60’s.
But there could still be precinct differences that I haven’t had time to analyze yet that could be driving that burst if in fact the algo didn’t have determining control at that point. If I had access to Polk county data which sits between Pasco and Osceola I would take a look at that for more context but it isn’t available on ordros currently…
lmao literally clicked on trending coins on coinmarket cap website and gravitoken popped up. I have got some EOS after great wins at this crypo sport betting... are there any ways to invest this straight to u? - https://tinyurl.com/3fbhv4ts